

Appreciate The Nuance(s)
According to the Oxford Library:
Nuance: (noun) – a subtle difference in or shade of meaning, expression, or sound.
As it pertains to investing, we use the adage that ‘investing is both an art and a science’ with the ‘art’ part representing the gray area that can’t be quantified or modeled yet must be accounted for in any analysis.
I start off this missive with that in mind because I find myself and our analysis lacking of much ‘black and white’ but rather full of gray (nuance) at the moment. ‘If’ this, then ‘that’, ‘that’ or ‘that’ is possible. ‘If’ that, then ‘this’, ‘that’ or ‘this’ is possible. Too often talking heads / market professionals (this humble analyst included) portray an image of absolute knowledge about a view when in most circumstances there is a lot of ‘nuance’ in said view that often doesn’t get the airtime it deserves when its delivered. That’s not an excuse for being wrong (clients don’t much care for them anyway), but rather a way of stressing the importance of keeping an open mind with one’s view and allowing for enough flexibility to make adjustments as the nuance in markets takes shape.
I don’t want to belabor the point nor turn this missive into a poor attempt at me babbling on about philosophy. The point I’m trying to convey is that the current investment backdrop is at a crossroads that is deeply entangled by a dynamic set of variables where one would be well served to have a fond appreciation for the nuance of the path of potential outcomes.
As for markets, it was an eventful week in terms of volatility – equities bounced violently sideways when all was said and done. The S&P 500 finished the week about +0.5% higher and the Tech-heavy Nasdaq gained +1.62% while the Dow and Russell 2000 fell, -0.24% and -2.19% respectively. The bigger story was the bond market where interest rates continued what has become a historic rise over the course of this tightening cycle. It’s really the nearly 180 bps rise in long-end yields since the end of August that now makes the climb in yields historic. Since the microscopic lows in yields in 2020, Treasuries with maturities of 10 years or more have plunged -46% in value and the long bond is down -53% in total return terms. This rivals the worst bear markets in the post-WWII era for the S&P 500 (-49% in the dotcom bust and -57% during the Great Financial Crisis). Even during the Volcker led Fed in the late-70’s / early-80’s the total return decline in the 10-year T-note was held to -16%. That’s some much-needed perspective on how severe this bear market in bonds has been.
I am of the view that there is now a ton of value in Treasuries with real rates on the 10-yr T-note at 2.5%, but many investors remain reluctant in part because the Fed continues to talk tough (although based on recent speeches from several Fed officials their hawkishness is subsiding) and the deluge of Treasury issuance on the back of insane U.S. deficits. For the first time in fifteen years retirees can make an asset allocation decision that was not available to them from the end of the GFC in 2010 through the end of the pandemic in 2021 and that is to get paid mid-single digit secure yields with very little risk of capital.
Sure, given the rise in yields over the past eighteen months which brought about the worst Treasury bond bear market in history I can understand why investors may be apprehensive about the risk from a further rise in yields, but I think such a view will prove to be short-sighted. Conditions have changed and in a dramatic manner relative to where the fundamental setup was even as recently as a month ago, let alone twelve months ago. Another 50bps rise in the yield on the 10-year T- note from 4.75% to 5.25% is dramatically different from an interest rate sensitivity standpoint than a rise from 1.50% to 2.0% or even 3.5% to 4.0%. The yield support from current interest rate levels goes a long way in insulating the downside price volatility in Treasuries at this point. In a nutshell, as the yield on the 10-yr and 30-yr Treasuries rise, the mathematics of their return over a long holding period become increasingly attractive relative to stocks. Add in the aging population which should naturally be interested in shifting their capital from more risky equities to less risky bonds and we’re talking about a backdrop where T.I.N.A (There Is No Alternative) can RIP.
The tightening in financial conditions is starting to bite hard. The rise in interest rates along with the shock to real incomes from the spike in oil prices and the end of the fiscal gravy train has created significant strain on the consumer. Then there is the surge in the dollar that will act as a tourniquet on the near-half of corporate sales derived from abroad. We also have credit spreads beginning to widen out and the average yield in the non-investment grade corporate bond market is now well over 9% and up 100 basis points in less than three months. Mortgage rates, now at 7.7%, are going to push even more people out of the housing market with negative implications for sales and starts.
Speaking of the housing market, mortgage applications are dropping like a lead balloon – down 18.5% year-over-year from what are already deeply depressed levels from a year-ago. We’re witnessing levels of housing activity that we last saw in the mid-90’s, that’s how depressed things have become. Consider the following table put together by Jeff Weniger comparing the difference in a house payment for someone who bought a house a few years before Covid, then refinanced, and is now looking to buy a different house that has one more bedroom. Call him or her the ‘move up’ home buyer that rolls all the equity they procured over time into the next house purchase. They are looking at a mortgage payment that is likely to triple and they are homeowners that did everything right. To think the dichotomy between mortgage rates and house prices is sustainable is delusional. Something has to give, and something will eventually.
Meanwhile, having already locked in their mortgage rates at historic lows two or three years ago, there is no opportunity for homeowners to tap into their home equity as they used to in the old days: refinancing activity has more than just dried up, plunging -6.6% in the final week of September and down in four of the past five weeks. While the majority of mortgage borrowers dodged a bullet by locking in low rates, the flip side of the equation is that when the Fed does decide to cut rates, it will be pushing on a string. There will be no meaningful positive effect from a “refi” perspective through the first 300 basis points of rate relief that is sure to follow this acute tightening cycle.
Sure, I’m open minded to the possibility that the Fed can thread the needle and engineer the elusive soft landing. But don’t allow that romantic notion to lull you into a state of complacency where you forget that in only three of the last fourteen tightening cycles has the economy not slipped into a recession. In most cases the Fed hikes interest rates until they break something, and I think we are nearing that point. The rising mark-to-market losses on bank balance sheets are mounting again and tremors are starting to be felt in capital markets. Bank of America’s stock is down 22% on the year and breaking below the levels if fell to during the SVB bankruptcy back in March. Credit default swap rates for both Bank of America and Citigroup are on the rise, which will be something investors focus on as Q3 earnings season gets underway at the end of the week with several big banks reporting.
Last Tuesday we witnessed one of those tremors in the corporate bond market where two companies pulled back on planned bond issues…remember, this is one of the dominos that fell in late-2018 that finally pushed an aggressive Powell and the Fed to the sidelines. We are seeing more and more signs in the economy and capital markets that the lags from the tightening that has already occurred are starting to bite. It doesn’t take much of an imagination to conclude that sustained policy rates north of 5% is a huge shock for the economy and financial markets given where we are coming from – the Fed funds rate averaged 0.6% in the ten years to 2019 and 1.8% over the two decades to 2019. Now we are north of 5% and because we had two years of massive fiscal spending which momentarily drowned out the tightening impacts, many investors think there is nothing to worry about? Dream on. Economic gravity awaits and while I want to be as hopeful and worry free as the next guy – I just can’t get there on a fundamental basis.
As for the inflation fight, the Fed is winning. Whether it’s the thawing of supply chains, a return to normality, or their policy actions that deserve the credit, the ‘why’ matters a whole lot less than the ‘what’. And in this case the ‘what’ is that inflation is on a glide path to the Fed’s target and argues that there is no need for any additional tightening. We’ll get the PPI and CPI inflation prints later this week, and while they are expected to tick up, these should be the last hot prints for the foreseeable future – forward markets have inflation sub-2.5% by next summer. The Truflation data (see chart below) has started to turn back down despite its inclusion of home prices in the data.
Outside of this weekend’s events in Israel that look set to potentially disrupt the Middle East and may be put a lift back in oil prices, commodity inflation is subsiding. Food prices are coming down as indicated by the UN FAO World Food Price Index which is down nearly 25% from the record highs in 2022 (to the lowest level since March 2021). This is a trend that looks set to continue to filter through consumer prices with a lag. A point that has come through loud and clear with recent earnings reports and comments from major food producers and grocery outlets (Kroger, ConAgra, Costco, and Walmart).
Bottomline, I think the Fed is done hiking and whether yields have peaked for this cycle or not – I don’t know – but bonds are at an attractive enough level that I think investors should own a decent chunk of them in portfolios. I’ll go as far as saying that I find them more attractive than equities over a 12-month time frame.
Here’s a little more nuance for you in how I’m looking at the setup at the moment. As I laid out above, I think fixed income is attractive and should be owned in size in all portfolios. I think the Fed hiking cycle is over (maybe one more 25 bps hike) and a real-yield of 2.50% on 10-year T-notes has historically been the cap in real yields during prior cycles. I also think the economy will not be able to withstand this most recent set of negative shocks from rates, the dollar, or oil all at the same time that fiscal support is rolling over. I remain of the view that the recession that many were calling for in the first half of 2023 has been delayed but not derailed. This is an expectation I will welcome being wrong on but remain flexible and proactive in managing portfolio positioning no matter the outcome.
The Investor’s Business Daily published a piece last week titled, “Fed Overkill? Economic Outlook Index Plunges To Record Low In IBD/TIPP Poll” which I think highlighted a stark contrast to the widely embraced ‘soft landing’ view:
“The IBD/TIPP U.S. Economic Optimism Index sank to a 12-year low in October as confidence in the near-term economic outlook crashed to the lowest level in the poll's history. The survey casts doubt on the Federal Reserve's justification for turning more hawkish last month: robust consumer spending.
The overall IBD/TIPP U.S. Economic Optimism Index dived 6.9 points to 36.3, the lowest since August 2011. Readings below the neutral 50 level reflect pessimism. The 6-month economic outlook index cratered 9.6 points to 28.7, a record low since the IBD/TIPP Poll began in early 2001.
October's 28.7 reading for the six-month outlook for the U.S. economy easily undercut its level of 30.6 in June 2022, which had been the lowest level since July 2008, when the country was mired in a recession.
That means the outlook suddenly appears worse than it was at the depths of the dot-com crash, the great financial crisis and the coronavirus pandemic.
The IBD/TIPP Financial-Related Stress Index jumped 2.4 points to 70.5, the highest level since December 2008. Readings above 50 indicate rising stress.
Yet the IBD/TIPP Poll finds that 54% of adults think the U.S. is in recession, up from 49% the prior two months. That number got as high as 61% in October 2022. Now 86% say they're concerned about a recession, up from 80% in September and just below the recent peak of 87% in May.”
Okay, Corey so far you continue to sound like the blathering bear we know you to be, what about that nuance you were about to get into. Yeah, right. On a strategic basis (call it a time horizon 6 – 18 months out) I remain cautious and fearful that we will slip into recession. Such an outcome is a risk to equities. However, given the correction in the equity market since the end of July, what I expect to be decent Q3 earnings, and the equity market entering the strongest part of its seasonal calendar – I’m constructive on stocks in the near-term. I think a fair amount of bad news is priced into equities at the moment. Add in the possibility that yields stop rising or even slide a little, the Fed acknowledges its pausing, and the economy remains resilient for the next several months – then I think we could have a decent rally that takes equities up 4 – 6% into year end.
So tactically (short-term basis) I think investors should be fully invested across the board going into year-end (stocks, bonds, gold, and commodities). Strategically, I still have my worries, but I’ve come to understand that about myself – I’m biased to the bearish side. Call it a casualty of managing other people’s money and not liking to lose it.
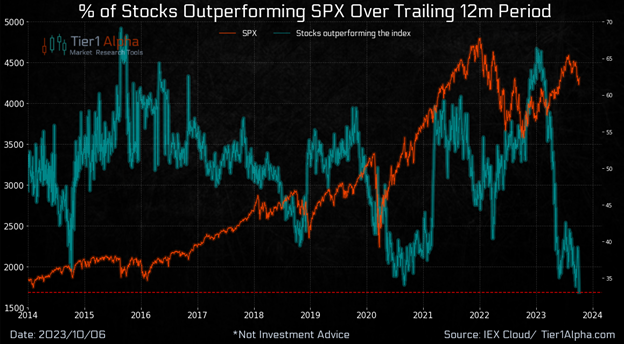
As for the stock market. When you look under the hood it just lacks the breadth one would expect to see if we were in the throes of a durable early cycle bull market. As large-cap equities attempt to bounce back from recent declines, small caps continue to signal a risk-off environment. The Russell 2000 is on pace to underperform its larger peers (as measured by the S&P 500) for the third straight year – the longest and deepest streak since the dotcom bubble of the late 1990s. Remember, these are smaller, more cyclically sensitive companies tied to domestic growth. According to data from Tier1Alpha (see chart below), only 33% of companies in the S&P 500 were outperforming the index itself over the past twelve months. This marks the lowest level we’ve seen since at least 2010 and highlights just how challenging a year it’s been for stock pickers, especially those who use the S&P 500 as a benchmark.
Jim Bianco put out the following charts on X that I think does a great job providing context to what is happening in the equity market beyond just the headline print. As of last Wednesday, with the S&P 500 at its lows for this summer swoon this was the biggest stock market drawdown since it bottomed in October 2022. Larger than the sell-off on the panic around the bank failures in March.

Mid-cap stocks (brown), small cap stocks (orange) and micro-cap stocks (green) were all down for the year.
And the "S&P 493" (blue) stocks, as a group, are now also down on the year.

However, it’s worth noting that even with all the rage about the Magnificent Seven stocks, only one of them (NVDA) has a positive return since the beginning of 2022 when the S&P 500 made its all-time high.
So yes, appreciate the nuance that accompanies navigating your capital through what is likely the most complex backdrop investors have experienced since the 1970’s. Also keep in mind that equity bull markets typically coincide with an economic recession, central bank easing, and everyone bearish. These conditions are not present today. Unbridled bulls need to be mindful of their blind spots in that they are swimming against the current. You can make some progress against the current (Fed tightening), but you exert a lot more energy to do so – says a lot about a stock market that is no higher today than it was in the summer of 2021.
The articles and opinions in "Capital Market Musings and Commentary" are for general information only, and not intended to provide specific investment advice. Performance, dividends and other figures have been obtained from sources believed reliable but have not been audited and cannot be guaranteed. Past performance does not ensure future results. Investing inherently contains risk including loss of principle. Advisory services offered through Casilio Leitch Investments, an SEC registered investment advisor.
Copyright © 2023 Casilio Leitch Investments. All Rights Reserved.